



19 Oct How to measure video outreach performance without stopping at views
Imagine a campaign with a 70% view rate and a 5% reply rate. On the surface, that 5% may look weak. But what if those replies became the strongest pipeline the team built all quarter, closed at twice the rate of email-sourced leads, and cut cost per meeting in half compared with cold calling?
Most teams stop at views and never look further. A real attribution framework connects video engagement to real outcomes: meetings booked, pipeline created, deals closed. For admissions and fundraising teams, the outcomes are enrollments and donations. Track the full path from the first video open to closed revenue.
The blind spot in standard video metrics
 Most video platforms hand you engagement metrics by default: views, average watch time, completion rate, and click rate on the call to action. These numbers help but stop short of the real answer.
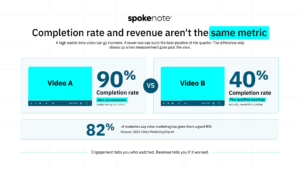
Engagement metrics show whether someone watched. On their own, they do not tell you whether that engagement moved the business forward. A video with a 90% completion rate and zero conversations has not performed, no matter how good the watch data looks on a slide. A video with a 40% completion rate and five qualified meetings might rank as the best content the team made this quarter.
Here’s the real gap: people watched the video, but did the video drive revenue? Most video measurement breaks down right at this gap. Teams underestimate their video ROI here too, because they compare video engagement numbers straight against email engagement numbers, without accounting for the different outcome each format produces downstream.
Video marketing data backs this up. Wyzowl’s 2026 Video Marketing Report found that 82% of marketers say video marketing has given them a good ROI, and 83% of video marketers say it has directly increased sales. Views are still the most common way to quantify that ROI, ranking ahead of leads and clicks. Only 32% of video marketers measure ROI through bottom-line sales. Proving those results means tracing measurement from engagement all the way to outcome.
Four layers to track
Four layers of data build a real attribution framework.
Layer 1: Video engagement
Start with the video platform. Track five things for every recipient: did they open the video, did they play the video, how long did they watch, where did they stop if they never finished, and did they click the call to action.
Watch time can be a useful engagement signal because it shows how much time someone actually spent with the message. Open rate and click rate never show you this. Treat strong watch time as a signal worth prioritizing in follow-up, not as proof of buying intent.
Layer 2: Behavioral response
Connect your video platform to your CRM. Set engagement events to trigger CRM updates automatically. Set engagement thresholds in your CRM based on your own sales cycle and historical conversion data, then use high-watch-time contacts to prioritize follow-up.
Send a different message to someone who opened but never played the video, compared to someone who watched and dropped off at twenty seconds. Video can provide more granular engagement data than email. Email shows you who opened and who clicked. Video shows you who watched, how much, at what pace, and whether they came back for a second watch. Build your follow-up sequence around this behavior, not a generic template.
Layer 3: Pipeline
Trace the path further. Which recipients who watched a personalized video turned into a real pipeline? What percent convert from view to meeting? From meeting to opportunity? And finally, from opportunity to closed deal? Build a real connection between your video platform and your sales tracking. Skip the spreadsheet someone updates once a month. Once connected, report a video-influenced pipeline with the same confidence you report any other channel.
Define “video-influenced” before you report it. A simple rule works: a contact counts as video-influenced if they watched a set share of the video, for example half, before a meeting or opportunity was created, within a set window such as 90 days. Pick thresholds that match your sales cycle, write them down, and apply them the same way every time.
Layer 4: Revenue
Compare cost per meeting across video, email, and cold calling. Compare close rate on video-influenced deals against every other source. Compare average deal size and lifetime value for customers who came through video. These numbers settle whether video pays off as an investment, not whether video looks good in a report.
Metrics by use case
B2B sales outreach
Track reply rate and meeting-book rate. Judge the channel on cost per closed deal, not cost per touch. A higher per-touch cost can still make sense if stronger downstream conversion improves the economics of the full funnel.
Higher education admissions
Yield rate matters most here. Compare deposit-to-enrollment conversion between students who received a personalized video and those who did not. Track summer melt rate by communication approach too. Watch email open rate, video completion rate, and financial aid completion rate as secondary signals. Compare video-contact and non-video-contact students within the same admitted cohort. The yield lift between the two groups should drive next year’s budget decisions.
Nonprofit fundraising
Track second-gift rate by comparing donors who received a personalized video thank-you with those who received a standard letter. Track response rate to annual appeals too. Watch average time-to-second-gift, upgrade rate, and lapsed donor reactivation rate as secondary signals. The second-gift rate works as the leading indicator here. Measure second-gift rate over a 12-month window, comparing the video cohort against the control group.
University advancement
Response rate and meeting-book rate matter for major gift cultivation. The real question: are prospects who received a personal video more likely to say yes when the ask comes? Track this separately from response rate. A prospect who replies differs from a prospect who gives.
Common mistakes in attribution
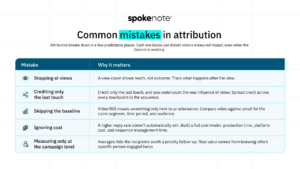
Attribution rarely breaks in dramatic ways. It breaks in small, repeatable habits. Each one on its own looks like a minor measurement choice. Together, they’re why a channel that’s actually working can still look like it isn’t on a report.
| Mistake | Why It Hurts | The Fix |
|---|---|---|
| Stopping the count at views | Views show attention, not outcomes. | Track through to meetings, enrollments, donations, or revenue. |
| Giving all the credit to the last touch | Ignores the video that started the conversation. | Report video-influenced pipeline alongside last-touch results. |
| Judging video in isolation | Without a baseline, the numbers mean very little. | Compare against email or a control group. |
| Leaving cost out of the ROI math | Strong engagement can hide a high cost. | Compare cost per meeting and cost per closed deal across channels. |
| Averaging results at the campaign level | Hides who actually engaged. | Track engagement for each recipient on their contact record. |
Build your measurement stack
Connect three systems at minimum. Your video platform generates engagement data for every recipient. Your CRM stores engagement events on every contact record. Your revenue tracking tags pipeline and closed deals as video-influenced.
This setup took custom engineering a few years ago. Now the setup counts as standard. Spokenote builds engagement analytics and CRM integrations, including Salesforce and HubSpot, directly into the platform. The success stories page shows documented results from Purdue’s admissions program alongside case studies across sports, nonprofit, and brand marketing teams.
Ready to see what your video outreach is really driving? Book a call with Spokenote.
FAQs about measuring video outreach performance
What metrics should you track for video outreach?
Track four layers. Start with engagement: opens, plays, watch time, drop-off point and call-to-action clicks. Then track behavior after watching, like replies and follow-up actions. Finally, track pipeline and revenue: meetings, opportunities, closed deals, enrollments or donations.
Are video views a good measure of success?
Views show that someone watched, not that the video moved them to act. A video with high completion and no conversations has not performed. A video with lower completion that books qualified meetings may be your best content.
How do you measure video marketing ROI?
Compare cost per meeting, close rate and deal size for video-influenced deals against email and cold calling. For admissions, compare yield between students who got a personal video and those who did not. For fundraising, compare second-gift rates over 12 months.
What does “video-influenced” pipeline mean?
It means a meeting, opportunity or deal where the contact engaged with a video before converting. Set a clear rule, such as a minimum watch time within a set number of days, and apply it the same way every time.
Why connect your video platform to your CRM?
Without the connection, video data sits in a separate tool and someone updates a spreadsheet once a month. Once it is connected, every view and click lands on the contact record, follow-up can be triggered by behavior, and video can be reported like any other channel.
What is the most common mistake in video attribution?
Stopping the count at views. Other common mistakes include giving all the credit to the last touch, judging video without a baseline like email, leaving cost out of the ROI math, and averaging results across a campaign instead of tracking who actually engaged.